Charts
ui::chart draws line, area, bar, scatter, pie and donut charts from arrays you own, with axes, a legend, a tooltip and keyboard picking built in. It lives in isolenui/kit/charts.h, which ui.h already includes. See the kit for how components link.
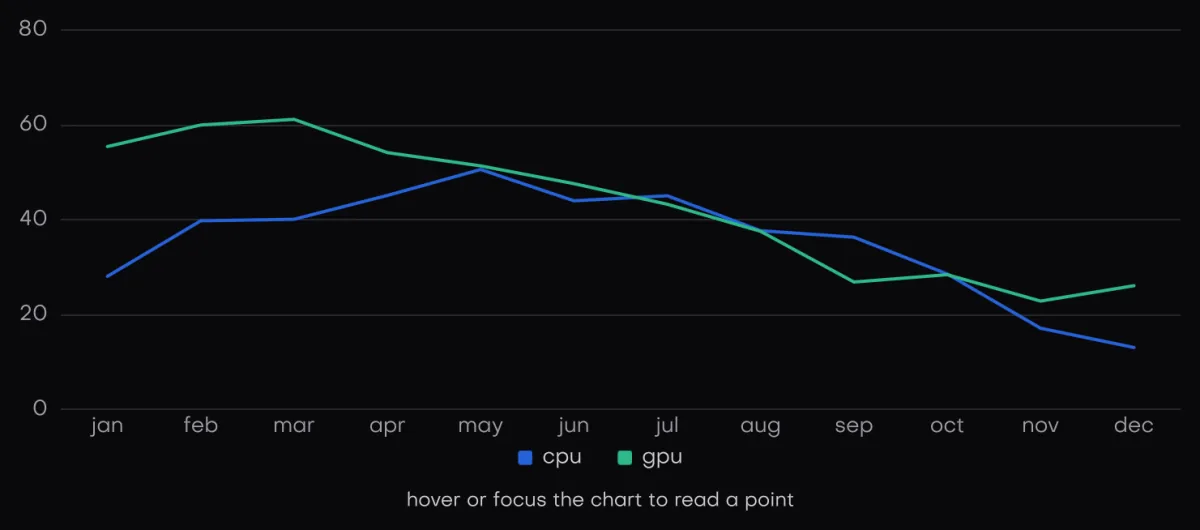
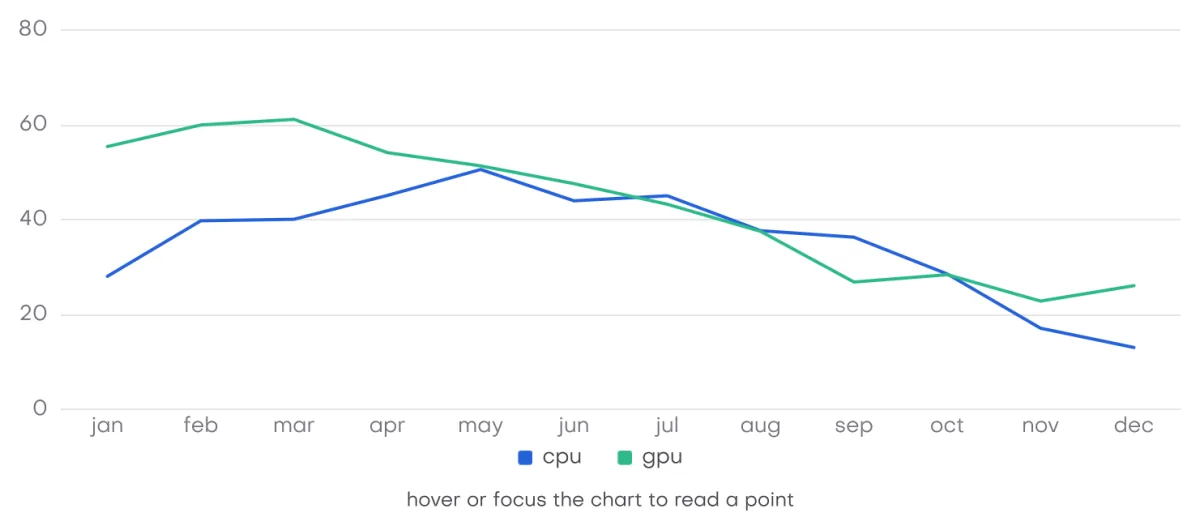
In the galleryChartchart
Kinds and flags
| Kind | Draws |
|---|---|
chart_line | A line per series. |
chart_area | A line per series filled down to zero. The y range always takes in zero. |
chart_bar | Bars per category, side by side with rounded tops, or one square stack with chart_stacked. The y range always takes in zero. |
chart_scatter | A dot per sample. Past 16384 visible samples a series collapses to vertical runs of occupied cells, cached per series until the data or the axes move. Dots less than half a cell apart stay single dots. When several dense series share a chart, the tallest in each pixel column is drawn first so shorter ones stay in front. |
chart_pie, chart_donut | Slices of the first series only, up to 64. The x labels name the slices. |
| Flag | Effect |
|---|---|
chart_stacked | Line, area and bar series add up. Hidden series drop out of the sums. |
chart_smooth | A monotone cubic between samples that never overshoots them. |
chart_points | A dot on each sample, only while there are at most a quarter as many samples as pixel columns. |
chart_no_grid | No horizontal rules at the y ticks. |
chart_no_legend | No legend row under the plot. |
chart_no_x_axis, chart_no_y_axis | No labels on that axis, and the plot takes their room. |
chart_no_tooltip | No tooltip for the picked sample. |
chart_no_crosshair | No crosshair line or band and no highlight dots. |
Series
A chart_series points at your samples: y with count values, an optional ascending x of the same length, a name for the legend and tooltip, and a color. A zero colour takes chart_color(theme, index). Without x, sample k sits at x equal to k.
A sample whose value is NaN or infinite is a gap. The line breaks there, and the tooltip and the ranges skip it. The engine builds with fast math, so the chart tests these on their bits rather than with float compares.
Set cap above zero and the samples are a ring: they start at head and wrap at cap, with at most cap of them read.
The chart caches its decimated columns and stack sums per series. A series is read again when its pointers, count, head, cap or version change. A series with version zero and at most 8192 samples is also read again every frame. A bigger one with version zero is trusted, so edits in place stay unseen until something else moves, and the chart logs a warning. Bump version whenever you change samples in place.
Axes and the spec
chart_of(kind, series, count) fills a chart_spec with everything else zero, except these defaults.
| Field | Default | Meaning |
|---|---|---|
line_w | 2 | Line width in px. Zero or below also means 2. |
point_r | 3 | Dot radius for points and scatter. Zero or below also means 3. |
bar_gap | 0.25 | Share of each category left empty around its bars. |
hole | 0.6 | Donut hole as a share of the radius, held to 0.95. |
centre | null | Donut centre text. Null shows the total, formatted with y.fmt. Drawn only when the hole is wider than 12 px across its radius. |
hidden | null | A uint32_t with a bit per series, or per slice on a pie. The legend flips the bits when clicked. Null makes the legend read only. |
overlay, overlay_user | null | Your paint call over the series, inside the plot clip. |
Each chart_axis has lo and hi. When they are equal the axis fits the visible data. fmt is a printf format for its labels. Null prints plain numbers, with k, M and B suffixes from ten thousand up. ticks asks for a tick count, and zero picks one from the plot size. On x, labels with label_count name categories. They turn line and area charts into category charts too, and they name pie slices. Category labels that would collide are thinned so only every nth one shows.
#include "isolenui/ui/ui.h"
#include "isolenui/kit/kit.h"
struct stats_panel {
float cpu_store[600];
ui::chart_ring cpu;
uint32_t hidden = 0;
};
static void setup(stats_panel* s)
{
ui::chart_ring_init(&s->cpu, s->cpu_store, 600u);
}
// called once per sample from the app, push moves the ring version
static void sample(stats_panel* s, float load)
{
ui::chart_ring_push(&s->cpu, &load, 1u);
}
static void panel(ui::ctx* u, stats_panel* s)
{
// a live line over the last 600 samples, the y axis held at 0 to 100
const ui::chart_series cpu = ui::chart_ring_series(&s->cpu, "cpu", 0u);
ui::chart_spec live = ui::chart_of(ui::chart_area, &cpu, 1u);
live.flags = ui::chart_smooth | ui::chart_no_legend;
live.y.lo = 0.0f;
live.y.hi = 100.0f;
live.y.fmt = "%.0f%%";
ui::chart(u, "cpu load", live);
// two series as grouped bars, named categories along x
static const float sent[4] = { 12.0f, 18.0f, 9.0f, 22.0f };
static const float read[4] = { 8.0f, 14.0f, 11.0f, 16.0f };
static const char* const quarters[4] = { "q1", "q2", "q3", "q4" };
static const ui::chart_series io[2] = {
{ "sent", sent, nullptr, 4u, 0u, 0u, 1u, 0u },
{ "read", read, nullptr, 4u, 0u, 0u, 1u, 0u },
};
ui::chart_spec bars = ui::chart_of(ui::chart_bar, io, 2u);
bars.x.labels = quarters;
bars.x.label_count = 4u;
// the legend flips a bit here for each series it hides
bars.hidden = &s->hidden;
const ui::chart_hit h = ui::chart(u, "traffic", bars,
ui::col().grow().height(200.0f));
if (h.clicked && h.series >= 0) {
// open the detail for quarters[h.index] here
}
}Live data with a ring
chart_ring is a ring over storage you own. chart_ring_init(r, storage, cap) empties it. chart_ring_push(r, v, n) copies n samples in, drops the oldest once full, keeps only the last cap when n is bigger, and bumps the version. chart_ring_series hands back a series that reads the ring in place, as the example above does.
Picking, tooltip and keys
chart returns a chart_hit. index is the sample or category under the pointer or the keyboard, or minus one. series is the visible series whose value at that index is nearest the pointer, and x and y are its values. hovered is true while the pointer is over a sample, and clicked on a click there or a keyboard pick.
- The plot joins the tab order. Left and right step through the samples, home and end jump to either end, and enter or space picks.
- The pointer wins over the keyboard anywhere over the chart, so the tooltip never sits in its way.
- The tooltip opens beside the pick with the category or x value on top and a row per series, up to 16. A pie row adds the slice's share in percent.
- The crosshair is a line on a continuous x and a band on categories. Line and area charts ring the picked samples. A picked pie slice pops out.
- Each legend entry is a button that flips its bit in
hiddenon a click or enter or space.
Pie and donut
#include "isolenui/ui/ui.h"
#include "isolenui/kit/kit.h"
static void storage(ui::ctx* u, uint32_t* hidden)
{
static const float bytes[3] = { 42.0f, 31.0f, 12.0f };
static const char* const kinds[3] = { "video", "audio", "other" };
static const ui::chart_series used = { "used", bytes, nullptr, 3u, 0u, 0u, 1u, 0u };
// a pie reads the first series only, x labels name its slices
ui::chart_spec spec = ui::chart_of(ui::chart_donut, &used, 1u);
spec.x.labels = kinds;
spec.x.label_count = 3u;
spec.y.fmt = "%.0f gb";
spec.centre = "85 gb";
spec.hidden = hidden;
ui::chart(u, "storage", spec, ui::col().width(260.0f).height(260.0f));
}Overlays and chart_frame
The overlay runs during ui::end with a chart_frame: the plot box and the value ranges the chart settled on this frame. chart_px_x and chart_px_y map values to pixels in it. Use it for limits, bands and markers.
#include "isolenui/ui/ui.h"
#include "isolenui/kit/kit.h"
struct limit {
double value;
uint32_t rgba;
};
// runs inside ui::end with the plot clip set, the frame maps values to pixels
static void draw_limit(gfx_list* l, const ui::chart_frame& f, void* user)
{
const limit* lim = static_cast<const limit*>(user);
const float y = ui::chart_px_y(f, lim->value);
gfx_fill(l, f.plot.x, y, f.plot.w, 1.0f, lim->rgba);
}
static void latency(ui::ctx* u, const float* ms, uint32_t count, uint64_t version)
{
// the limit must outlive the frame since the overlay reads it in ui::end
static limit lim = { 50.0, 0xff4040e0u };
const ui::chart_series s = { "latency", ms, nullptr, count, 0u, 0u, version, 0u };
ui::chart_spec spec = ui::chart_of(ui::chart_line, &s, 1u);
spec.flags = ui::chart_points;
spec.y.fmt = "%.0f ms";
spec.overlay = draw_limit;
spec.overlay_user = &lim;
ui::chart(u, "latency", spec);
}ui::end, when the chart paints. Series, samples, x values, labels, the hidden word and overlay_user must all stay valid until ui::end returns. The spec and the series structs are copied, but not the arrays they point at.Size and colours
The three argument chart takes the full width and 240 px of height. Pass a style to the four argument form to size it yourself. The legend sits under the plot inside that box.
chart_color(theme, index) returns one of eight fixed colours, the index taken modulo 8. The theme now carries a chart[8] palette, but chart_color does not read it yet, so the theme argument is ignored.
Helpers
chart_ticks(lo, hi, most, &first, &step)finds nice 1, 2, 5 ticks covering the range and returns how many. It stays withinmost, or three for a range across zero.loandhimust be finite.chart_decimals(step)gives the digits after the point that tell ticks of that step apart.chart_decimate(y, n, columns, out4)writes first, min, max and last for each column, which is what a line needs to draw one pixel column exactly. A column with no finite sample holdschart_gap. Lines with more than two samples per column draw this way.chart_range(y, n, &lo, &hi)finds the min and max ignoring NaN and infinity, and returns false when no sample was finite.
#include "isolenui/ui/ui.h"
#include "isolenui/kit/kit.h"
#include <stdio.h>
// the same helpers the chart uses, for axes an app paints itself
static void axis_labels(float lo, float hi)
{
double first = 0.0;
double step = 0.0;
const uint32_t n = ui::chart_ticks(lo, hi, 6u, &first, &step);
const uint32_t dec = ui::chart_decimals(step);
for (uint32_t i = 0; i < n; ++i) {
printf("%.*f\n", int(dec), first + step * double(i));
}
}
// first min max last per pixel column, a column with no finite sample holds chart_gap
static void columns(const float* y, uint32_t n, float* out4, uint32_t width)
{
float lo = 0.0f;
float hi = 0.0f;
if (ui::chart_range(y, n, &lo, &hi)) {
axis_labels(lo, hi);
}
ui::chart_decimate(y, n, width, out4);
}